While efforts to shift to a decarbonized society are accelerating, greenhouse gases such as CO2 emitted in connection to consumer lifestyles account for more than 60% of total emissions. In particular, the lifestyles of urban residents, who are also major consumers, rely on external sources for the supply of various products, services, and energy, resulting in significant direct and indirect effects on climate change.
This page provides interactive visualization of the data from the article "Exploring carbon footprint reduction pathways through urban lifestyle changes: a practical approach applied to Japanese cities" published in Environmental Research Letters. This study estimated the carbon footprint of the average citizen in 52 major Japanese cities (prefectural capitals and government-designated cities), identified 65 decarbonized lifestyle options related to mobility, housing, food, leisure, and consumer goods, and assessed city-wise greenhouse gas reduction potential.
These data are based on the concept of a carbon footprint, which quantifies the environmental impact of products and services from cradle to grave. This method has been adopted by the business sector as a “Scope 3” indicator, and this study utilizes this concept for assessing consumer lifestyles and their transition.
Most previous studies on the reduction of greenhouse gas emissions through lifestyle changes by citizens have focused on the country-level average and have not simultaneously analyzed a large number of cities, although consumer lifestyles and local conditions vary from city to city. In this study, we proposed a method for analyzing the impacts of lifestyle changes in multiple cities using a consistent framework and applied it to 52 major cities in Japan.
Visualization of the direct and indirect greenhouse gas emissions (carbon footprint) associated with the lifestyle of an average citizen (mobility, housing, food, leisure, use of consumer goods, and services) in 52 cities in Japan.
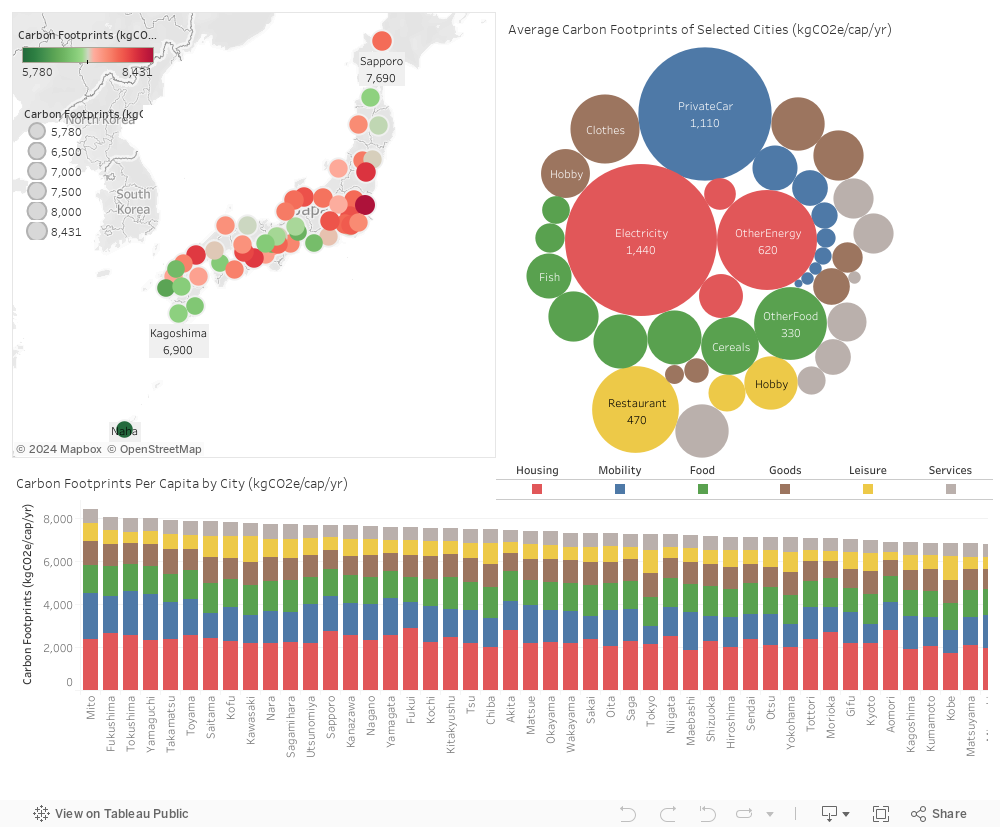
If you are interested in a particular city, click on the name of that city on the map or in the bar graph (bottom). The bubble chart (upper right) shows the carbon footprint (in kgCO2e, CO2 equivalent) per person per year by consumption domains such as mobility, housing, food, leisure, and consumer goods.
If you are interested in a particular consumption domain (broad categories such as mobility, housing, food, consumer goods, leisure, or services), click on the colored squares. A bar graph shows the cities in descending order of emissions for the selected domain or component (bottom). On the map, the size and color of the circles (red and green for large and small footprints, respectively) indicate the size of the footprint.
If you are interested in a particular consumption component (e.g., the impact on climate change through consumption of private cars, airplanes, electricity, clothing, or meat), you can click on the particular consumption component in the bubble chart (top right) to see a comparison between cities as a bar chart or map.
You can zoom in and out of the map. If you select multiple cities or components while holding the control key (Windows) or command key (Mac) down, the average for the selected cities or components is displayed.
Visualization of decarbonized lifestyle options (including mobility, housing, and food) in each city and city-by-city comparisons of the carbon footprint reduction potentials of specific options.
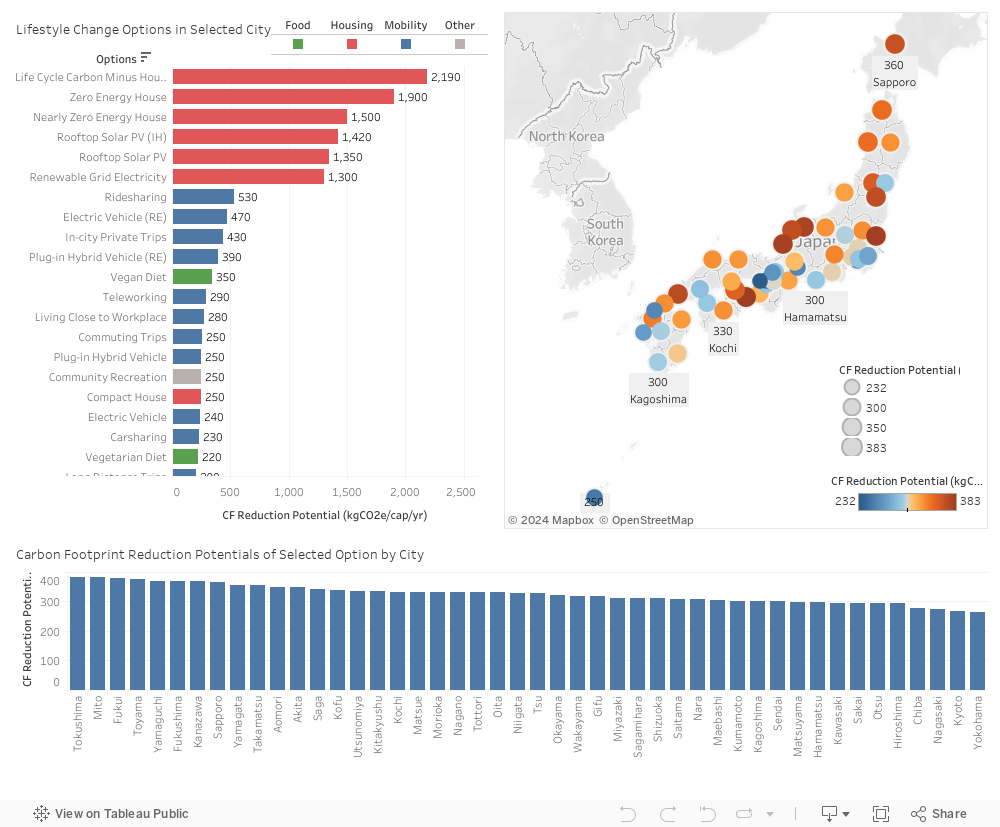
If you are interested in a particular city, click on the name of the city on the map, and a bar graph (on the left) will show the decarbonized lifestyle options in order of effectiveness for that city. The numbers represent the technical maximum reduction potentials in the carbon footprint (in kgCO2e, CO2 equivalent) per person per year if these options were adopted to the maximum extent possible, assuming the average citizen.
Decarbonized lifestyle options can be extracted for specific consumption domains (including mobility, housing, food, or consumer goods). To do so, click on a colored square in the upper-left corner. For example, clicking on the blue square will allow you to view the options for mobility for a particular city.
If you are interested in a particular decarbonized lifestyle option, click on that option label (on the left) in the bar graph. On the map, you can see the maximum reduction potentials by city for that option represented as circles of different sizes and colors (red and green for large and small footprints, respectively). You can also see the maximum reduction potentials for the corresponding option in the form of a ranking by city (bar graph in the lower right).
You can be zoom in and out of the map. To deselect a city or consumption component, click on the blank area. If you select multiple cities or options while holding the control key (Windows) or command key (Mac) down, the average for the selected cities or options is displayed.
If you wish to use any of the figures or graphs presented by this data, please use the following citation:
Ryu Koide, Satoshi Kojima, Keisuke Nansai, Michael Lettenmeier, Kenji Asakawa, Chen Liu, Shinsuke Murakami (2021) Exploring Carbon Footprint Reduction Pathways through Urban Lifestyle Changes:A Practical Approach Applied to Japanese Cities. Environmental Research Letters. 16 084001 https://doi.org/10.1088/1748-9326/ac0e64
For more details on the estimation method and data sources of this study, please refer to the paper published in Environmental Research Letters (Koide et al. 2021).
Greenhouse gas reduction estimates are based on the average citizen in the city adopting an option to the fullest extent possible (100% adoption rate) (e.g., teleworking every day, switching completely to electric cars). In the case of partial adoption (e.g., teleworking 3 days a week, eating vegetarian food 1 day a week), the reduction potential can be estimated by multiplying the listed figures by the adoption rate (e.g., 50% in the case of adopting an option for a single day from a maximum of two days).
The reduction effects are based on the average citizen in a particular city. Therefore, the reduction potential for the relevant option may be larger or smaller for residents of that city who have a larger or smaller carbon footprint for a particular consumption. For items whose usage is skewed toward a few citizens (e.g., international air travel), the reduction effect is likely to be even greater for those citizens whose usage is high.
The reduction effect also considers the emissions required to implement the technology (e.g., emissions from the manufacture of electric vehicles), but does not include the rebound effect through expenditure and time use. Therefore, when an option is introduced, the reduction effect may be partly canceled out by transferring the saved money and time to other modes of consumption.
The base year for the city-specific carbon footprint and options was 2015. Therefore, the baseline for the estimated reductions is from before the lifestyle adopted owing to the COVID-19 outbreak. If the period under the COVID-19 outbreak is used as the baseline, the expected reduction effect may be different.
The National Institute for Environmental Studies (NIES) assumes no responsibility for any disadvantages arising from the use of these data. In addition, the NIES does not guarantee the validity of the results of data analysis or interpretation.